
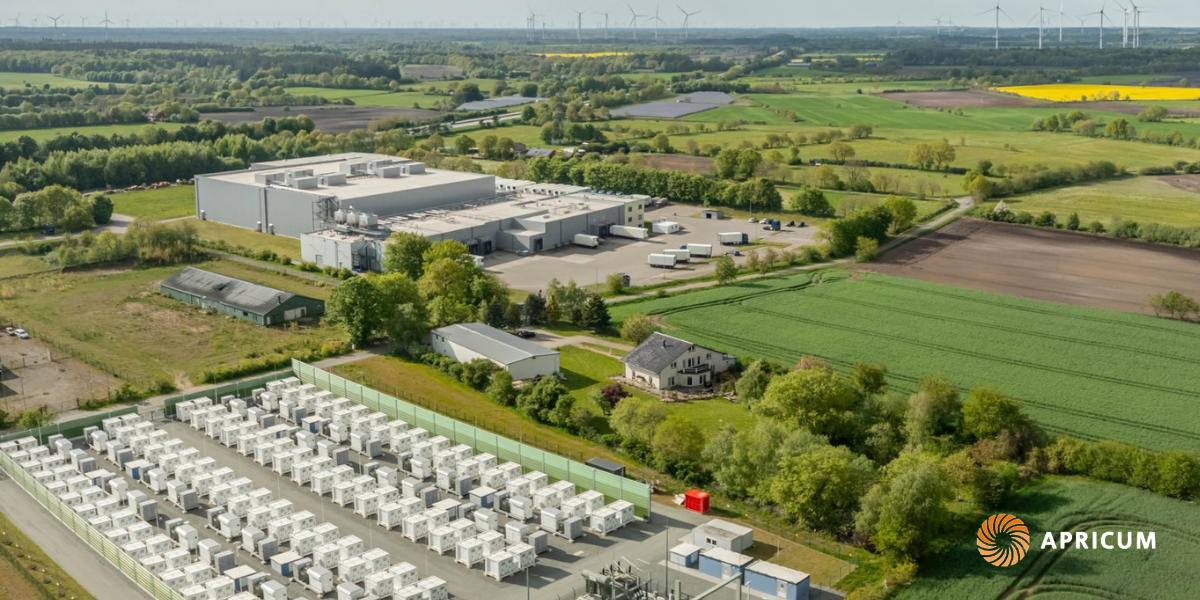
BESS financing on a non-recourse basis has gone mainstream for standalone battery storage projects in Europe, including merchant deals. For sponsors, the question is no longer whether a BESS project can be financed, it is how much debt they can reasonably expect to raise, and under what gearing and tenor terms.
Two and a half years ago, a standalone battery project was a hard sell to project finance banks, and nearly unthinkable without a long-term offtake. Today it is routine. Across the European Union, I’ve identified 40 standalone BESS projects that have reached financial close on a non-recourse basis since 2024, raising more than €3.4 billion of debt and supporting roughly 7 GW of new capacity, spread across 14 countries. That is enough precedent to underwrite against — and enough data to start answering the question every sponsor eventually asks their advisor: how much can I actually borrow?
This article sets out a benchmark built from that precedent: 27 of the 40 financings disclosed their debt quantum, and normalizing debt raised against installed MWh across those deals produces a European average of €226,000 of debt per MWh of installed capacity. The 13 transactions that did not disclose total debt, including two in 2024, are excluded, so the benchmark covers deals that closed between January 2025 and August 2026. It is not a substitute for a bank’s own credit work, but it is a useful reality check before a sponsor sets expectations or walks into a room with lenders.
How deep is the European BESS debt market?
Deep enough to provide confidence that a well-structured deal can raise a reasonable level of non-recourse debt, though not yet deep in the way the wind and solar financings are underwritten.
Of the 40 closed financings, 37 disclosed their lenders, and between them, those deals drew on 35 different lenders. No single lender or lender group has emerged as the default underwriter, in the way DFIs and a handful of commercial banks did for early-stage solar: the most active lender appears in seven deals, fewer than one in five, and no other lender appears in more than six.
Commercial banks dominate the lender base, accounting for 24 of the 35 lenders. A core group of seven banks, five of them Dutch or Belgian, have each backed five or more deals (the “core group”), and together they sit on just under half of the 37. Behind them is a long tail: 15 lenders have backed only a single deal. DFIs play a much smaller role than they did in early-stage solar, appearing on just three deals, alongside a handful of institutional debt funds and regional public investors.
Deal structures split fairly evenly. Seventeen of the 37 deals were bilateral, funded by a single lender, while six were club deals with five or more lenders each.
Merchant risk is where the lender base divides most clearly, with the busiest lenders mostly staying away. Merchant projects account for 17 of the 37 deals, but for only 7 of the “core group’s” 40 deal appearances (under 20%). Merchant financing leans instead on the long tail: 8 of the 15 single-deal lenders came in on a merchant project.
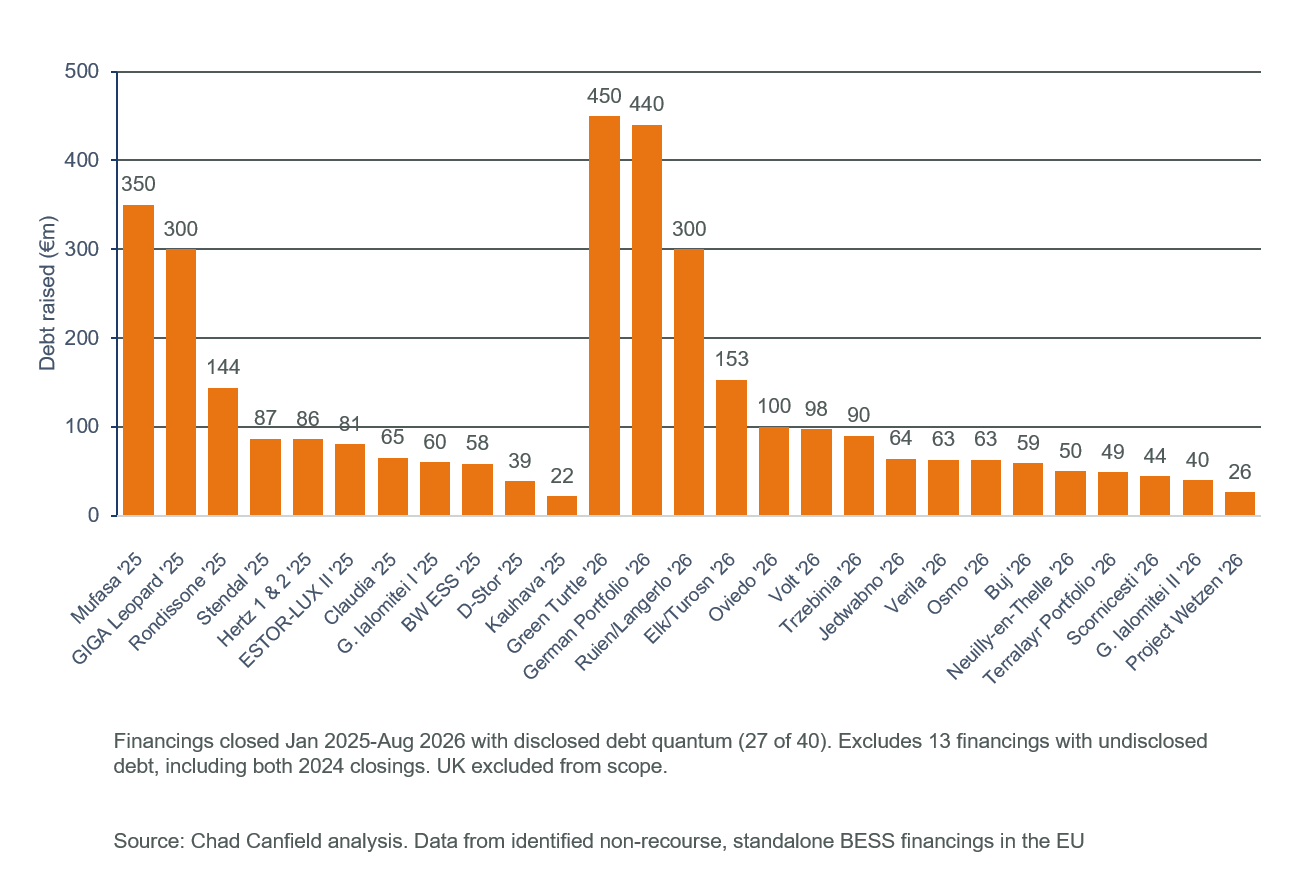
Transaction size ranged from €22 million[1] to €450 million, averaging c.€125 million — the largest being a loan to Green Turtle in Belgium, a project partially backed by a 15-year capacity remuneration mechanism; the smallest disclosed debt supported a merchant project in Finland.
Of the 40 financings identified, 27 disclosed a debt quantum; a further 13 European transactions closed in the same window but did not disclose the amount raised and are excluded from the benchmark below (Figure 1).
Figure 1: EU project financings with disclosed debt (€m)
How much can a project borrow? Two tests set the ceiling
In practice, the maximum loan faces two separate constraints, and whichever one bites first, sets the loan amount.
The first is a maximum debt-as-a-share-of-project costs test. Lenders cap senior debt at a set percentage of total project cost (sometimes capex), with subordinated debt and equity funding the balance; precedent across the 40 deals suggests 50–80% gearing is achievable. This ceiling applies before cash flow is even tested.
The second is a minimum debt service coverage ratio (DSCR) test. Projected cash flow must exceed debt service by a required multiple in every period, and the single tightest period sets the sizing — lenders require higher ratios against merchant cash flows than against contracted ones. Loan tenor also matters here: a longer loan term can improve coverage ratios by way of reducing required amortization, and higher coverage ratios can expand debt capacity, independent of gearing.
A note on units: MWh not MW
One methodological point worth flagging to any sponsor building their own model: this benchmark sizes debt against energy (MWh), not power (MW). Two 100 MW projects are not the same asset. A 2-hour battery is 200 MWh; a 4-hour battery is 400 MWh. The longer-duration project costs more to build and earns more revenue per cycle, so identical nameplate capacity can support very different loan sizes and faces different coverage tests. Both sizing tests above are ultimately driven by the asset’s energy, not its power rating — which is why €/MWh, rather than €/MW, is the more useful benchmark for cross-project comparison.
The benchmark: circa €226,000 of debt per MWh
Across the 27 disclosed financings, the average comes to c.€226,000 of debt raised per MWh of installed capacity, with a median of c.€214,000 — close enough that the average is not being pulled by outliers in one direction.
Figure 2: Debt / MWh ranked high to low (€000/MWh)
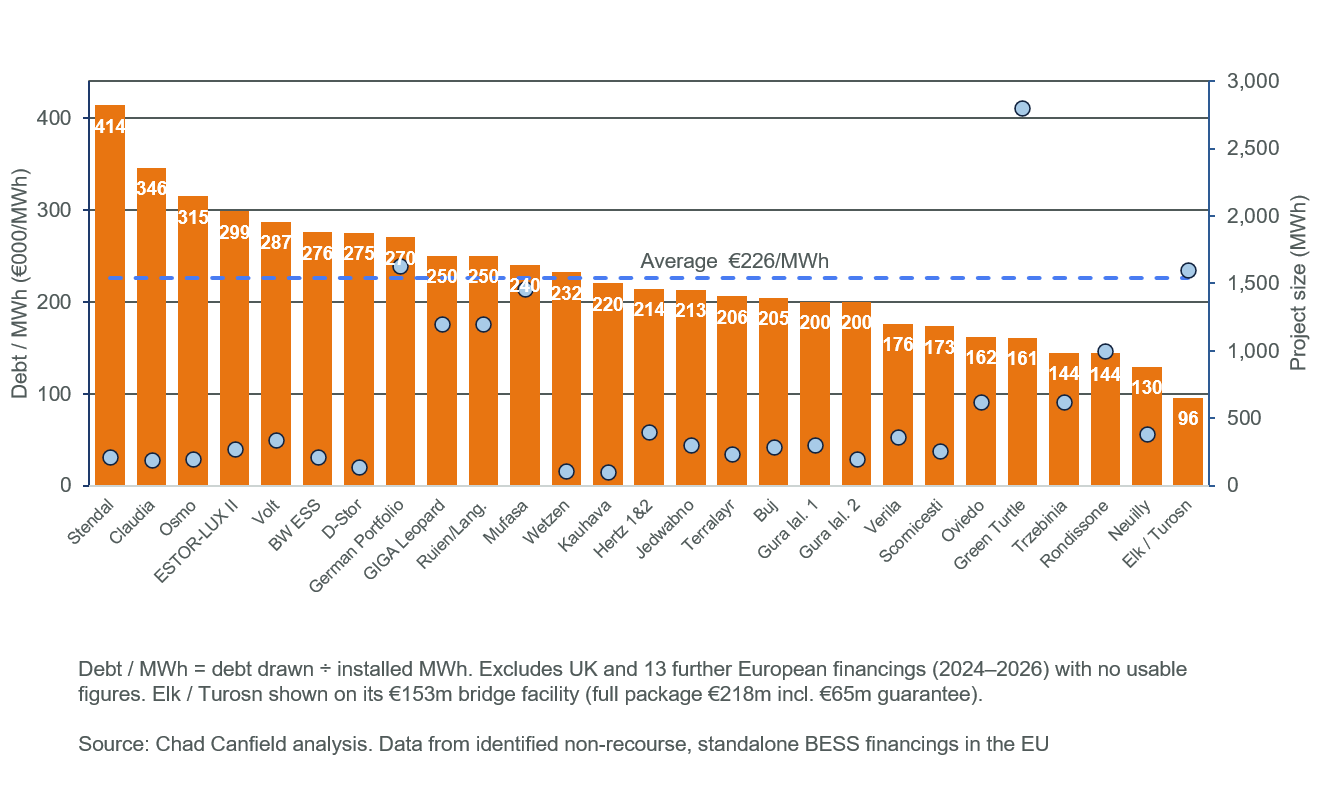
Three observations stand out from the data behind Figure 2:
- There is real spread: only 12 of the 27 deals fell within ±20% of the average. This suggests the bank market has not yet standardized its underwriting criteria, leaving genuine room to negotiate debt capacity.
- The range is wide: debt per MWh runs from roughly €96,000 to over €410,000.
- Project size explains little of the spread: larger projects tend to raise slightly less debt per MWh, but the relationship is weak.
Does a fixed-price revenue stream actually raise more debt?
Intuitively, a contracted revenue stream — whether a capacity payment, a CRM, tolls, floors, or other long-term offtake — should unlock materially more debt than merchant exposure. The data says otherwise.
Contracted deals in the sample averaged €222,000 of debt per MWh; merchant deals averaged €234,000 (Figure 3), meaning to date, merchant projects have attracted marginally more debt per MWh, not less.
Figure 3: Average debt raised per MWh. Merchant projects raised c.5% more debt per MWh than contracted ones
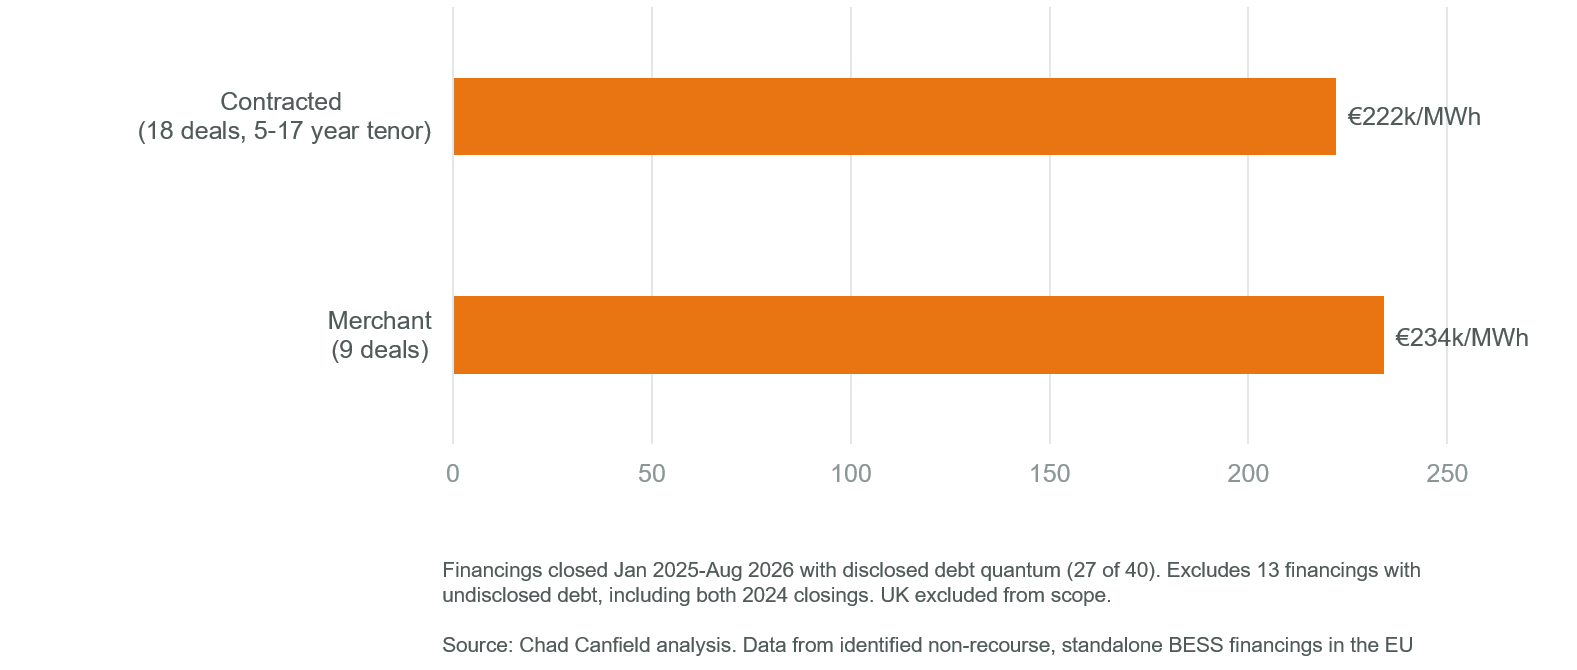
That is a genuinely counter-intuitive result, and it comes with an important caveat: it measures the amount of debt, not the cost or terms of that debt. The real advantage of a contracted revenue stream in this dataset is not quantum but duration — contracted deals in the sample carried longer loan tenors (the longest tied to the 17-year Polish capacity payment mechanism, with Belgian and Italian CRM-backed deals running 15 years). Merchant deals cost more, they have shorter debt tenors, and one can assume restrictive required sweeps. A sponsor negotiating a PPA or capacity contract should expect better terms, and a better project IRR — rather than assuming it will simply unlock a bigger check.
What this means for sponsors approaching lenders
Three takeaways for a sponsor preparing to raise non-recourse debt against a standalone BESS project in Europe today:
- First, the market has enough precedent — 40 deals, 14 countries, €3.4bn+ of debt — to negotiate from a position of knowledge rather than guesswork. A sponsor who walks into bank meetings citing benchmark gearing, DSCR and €/MWh figures is negotiating from a stronger position than one asking lenders to name a number.
- Second, size debt against energy (MWh), not power (MW), from the outset. Modelling and negotiating on a €/MW basis will misstate what a given duration of battery can actually support.
- Third, don’t assume a contracted offtake is primarily a quantum play. In this dataset it is a duration and pricing play — useful for IRR and structuring, but not a guarantee of a materially bigger loan.
The market is still young enough that individual deal terms vary widely, and every project’s bankability ultimately comes down to its own site, technology, contracts and sponsor track record. But with 40 data points now on the board, “what can I borrow” finally has a benchmark behind it rather than a guess.
To find out more about Apricum’s energy storage and financing work, contact Apricum Managing Partner Nikolai Dobrott or Apricum Senior Advisor Chad Canfield.
About this analysis
This analysis covers 40 non-recourse, standalone BESS financings that reached financial close in the EU between 2024 and August 2026. Co-located projects and the UK are excluded. The first two financings closed in 2024, and no earlier EU deals were identified.
Thirteen of the 40 financings, including both 2024 closings, did not disclose a debt quantum and are excluded from the €/MWh benchmark. The benchmark therefore rests on 27 financings that closed between January 2025 and August 2026.
Deal information was compiled from public sources. Where a project bundled ancillary facilities (VAT, DSRA, guarantee lines) alongside senior debt, the debt/MWh figure may be overstated.
[1] One transaction likely raised less than €22 million; Blackvolt announced it had closed a “senior secured financing in the double-digit million euro range” for its merchant project in Austria. Using the average merchant debt of €234k/MWh x 36MWh, total debt would equal €8.4 million for the ‘Orlando’ project.