The global PV market is showing no signs of slowing down, but it is important to know how this demand is shifting among the markets around the world and the scale of opportunity in each region. During the past three years, the industry has observed a major shift in demand from European markets to Asia, specifically China and Japan, and to North America, particularly the USA. Looking forward, where will the most PV be installed and which countries are driving growth? How do emerging regions like South America, MENA and Africa fit in? In this article, we’ll answer these questions by presenting information from Apricum’s proprietary global PV market model, which we use regularly for analysis and client-based projects. Apricum’s market model is updated on a quarterly basis. Apricum maintains similar market models for both the wind and the CSP industries.
Figure 1: Global annual and cumulative installations, 2014–2020 [GW]

Source: Apricum PV Market Model Q3 2015, center scenario
As illustrated in Figure 1, the global PV market continues to expand as the cost of PV-generated electricity falls, new government programs are introduced, demand for electricity increases, awareness improves and countries seek to alleviate pollution and CO2 emissions. Table 1 identifies which countries will be the largest in terms of installed base by the end of the decade and it should be no surprise that China leads the pack by far.
Table 1: Top five countries by cumulative capacity in 2020 [GW]
| Rank | Country | PV Capacity |
|---|---|---|
| 1 | China | 180 |
| 2 | USA | 83 |
| 3 | Japan | 57 |
| 4 | Germany | 46 |
| 5 | India | 41 |
Source: Apricum PV Market Model Q3 2015, center scenario
In 2020, more than double the capacity that was installed in 2014 will be connected (92 GW compared with 42 GW, respectively). To identify the key regions driving growth, we show the difference between each region’s projected new 2020 installations and its annual installations in 2014 (see Figure 2). By doing this, it becomes clear which countries and regions should garner the most attention from solar companies. China, India and the USA combined will install 36 GW more in 2020 than they did in 2014, making up over 70% of the additional 50 GW of installations worldwide over that timeframe.
Figure 2: Change in annual installations from 2014 to 2020, by country [GW]

Source: Apricum PV Market Model Q3 2015, center scenario
The first region that we take a deeper look into will be Asia Pacific, where China will remain the engine for regional and global growth over the next five years as it seeks to reduce its reliance on coal power generation to alleviate major pollution problems across the country and to provide demand for its large local PV manufacturing industry. Japan, which has been the second largest PV market in the world during 2013 and 2014, will begin to slow its furious pace of installations driven by its generous feed-in-tariff program, but will remain a multi-GW market in 2020. As Japanese installations decelerate, other countries in the region will provide ample new demand. India, in particular, will emerge as one of the key global PV markets as it attempts to reduce pollution, improve access to electricity and build a local PV manufacturing sector through its aspiration to install 100 GW by 2023. With high electricity prices as a major driver, countries like Australia and the Philippines will also experience significant growth. Lastly, South Korea, which generates almost as much electricity as Germany (~85% in 2014) and is home to several PV manufacturers, will grow into a significant PV market by 2020.
As shown in Table 1, the USA is expected to build up the second largest PV installed base in the world by 2020. The PV industry there is priming for a huge construction boom this year and next, followed by a steep decline in utility-scale installations in 2017 (in a business-as-usual scenario) as the federal investment tax credit drops from 30% to 10%. Even in this business-as-usual scenario, however, the market will be buoyed beyond 2016 by the booming rooftop sector and system cost improvements. Furthermore, announcements such as President Obama’s Clean Power Plan and Hillary Clinton’s target of 140 GW by 2020 provide ample room for optimism in any US market outlook.
In addition to the USA, strong irradiation, growing power demand and government goals to increase the share of renewables in generation will drive huge growth in the Mexican PV market, which is expected to become a GW-scale market before the end of the decade. While Mexico features major upside potential, regulatory uncertainties mean there is a significant chance for delays. In Canada, as the Ontario government winds down its feed-in-tariff program, other provinces or perhaps a new, progressive government (elections to be held in October 2015), will have to drive further renewable energy adoption.
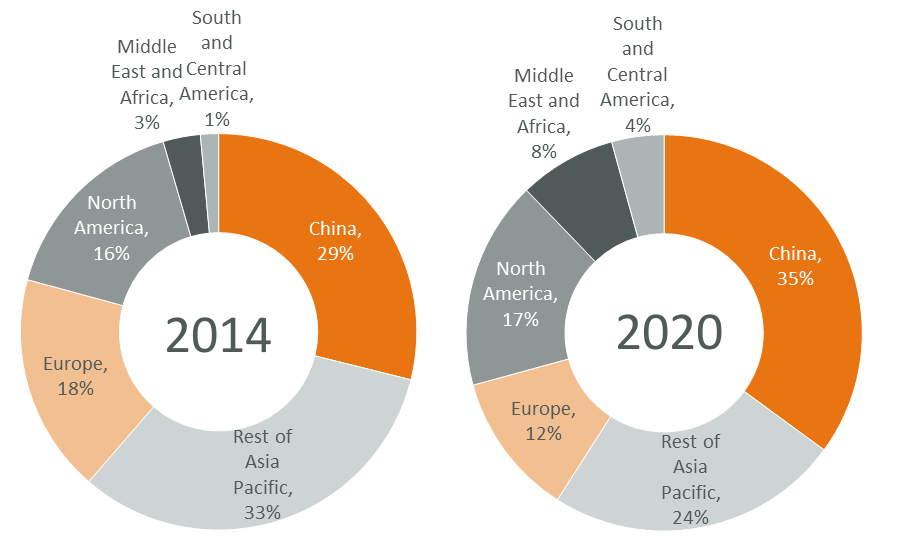
Europe, the former stronghold of the global PV market, will account for a diminishing share of worldwide installations (see Figure 3). There will remain, however, several pockets of growth in Europe, and as seen in Figure 2, the European market as a whole is still expected to grow from 2014 to 2020 on an absolute basis. France will compete with Germany as Europe’s largest PV market over the next five years as its government seeks to add renewable energy generating capacity in place of new nuclear. The UK, which experienced a major PV construction boom in 2015, will revert to a moderately-sized market driven mainly by commercial- and residential-scale projects as a result of the current government’s opposition to large-scale, onshore renewable energy projects. Furthermore, as a result of high electricity prices, solar plus battery storage will begin to approach grid parity in several markets including Germany and Italy. This will trigger a wave of new residential installations – the full effect of this driver may not be fully felt until after 2020, though, when it is likely to spark a European PV renaissance.
Figure 3: Regional shares of new annual installations, 2014 and 2020 [%]

Source: Apricum PV Market Model Q3 2015, center scenario
Among the fastest growing regions in the world are Africa and the Middle East. The key driver in Africa is energy scarcity and improving access to electricity for the population. Taking the first major steps in PV on the continent was South Africa with its renewable independent power producer tender program, which continues to be a major PV demand driver. In the MENA region, there is a clear trend of energy-importing countries, such as Morocco, Egypt, Jordan and Israel making the first move into renewable energy. Large and small-scale PV programs in these four countries are underway. In addition, extremely low prices for PV-generated electricity have been achieved in competitive tenders in the region. The prime example is the tariff of 5.85 USD cents/kWh for a 200 MW PV project achieved in Dubai, which has generated a serious buzz in the region; the project is fully bankable and has reached financial close. This demonstration of the cost competitiveness of PV cannot be ignored and is opening doors to ever more projects in MENA and beyond.
Finally, South and Central America, which represents another high-growth region, will be powered by the mammoth Brazilian market. As it ramps up the share of PV in its power auctioning system and as residential/commercial-scale rooftop projects take hold, Brazil will become the most important market in South America. Heavy competition in the auctions and plans for several module manufacturers to set up shop in Brazil are key indications that it will be a major PV market for years to come.
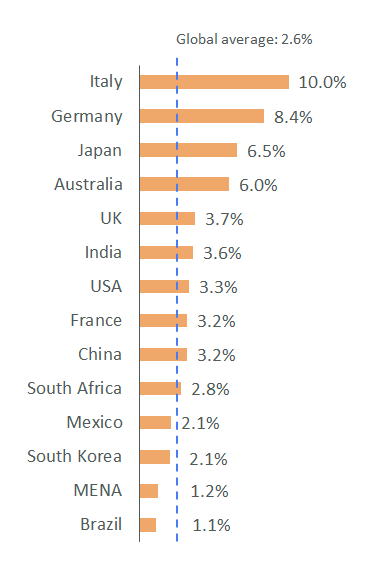
With such huge installation numbers expected, will the solar market be saturated in 2020? Far from it – even in the major PV markets such as China, USA and India, PV will have reached relatively low penetration into the electricity generation mix by 2020. Italy and Germany have already shown that PV penetration in the high single digits is manageable with today’s limitations. Given that the maximum possible penetration of fluctuating renewables is a limit that is continually inching higher because of improving storage technologies, demand management and a smarter grid – to name a few drivers – there is huge potential for further growth beyond 2020.
Figure 4: Projected PV Share of Electricity Generation in 2020, by Country [Selected Markets]

Source: Apricum PV Market Model Q3 2015, center scenario, US EIA, BP Statistical Review of World Energy 2015
For questions or comments, please contact Apricum Senior Consultant James Kurz

